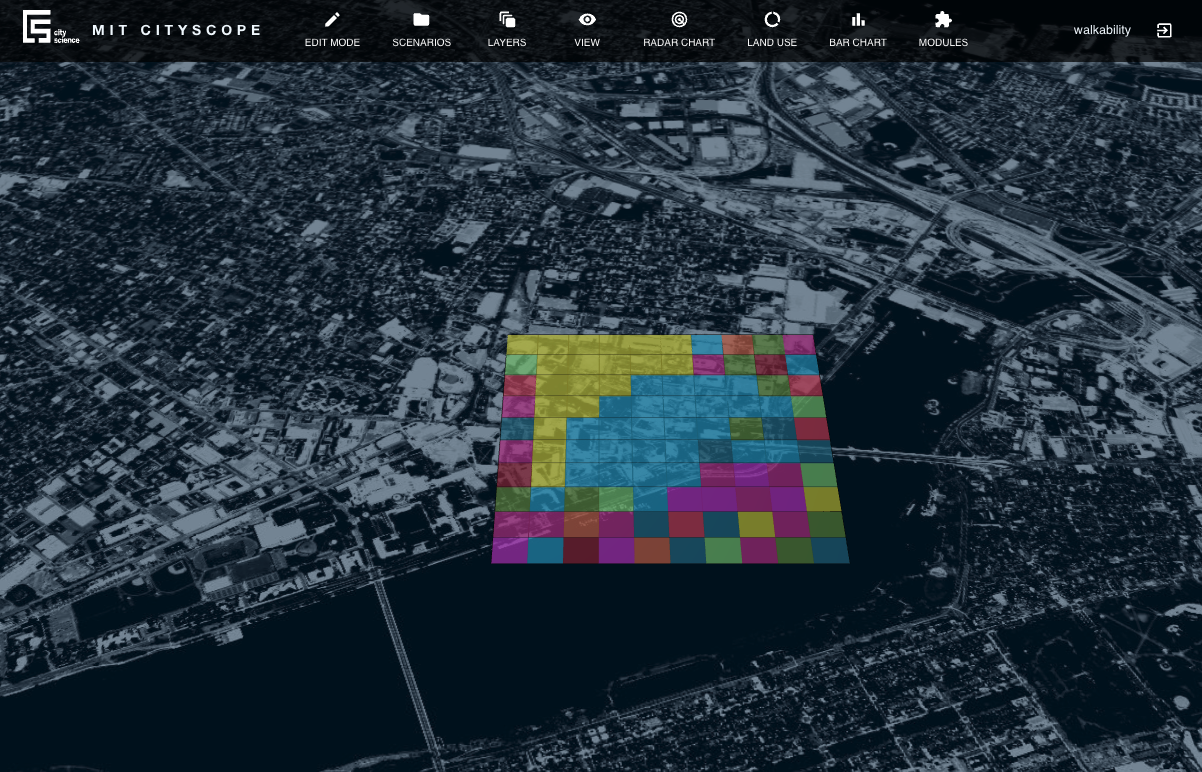
Project view
When you open a project, CityScopeJS will present you with the project view. This page aims to provide a workspace where you can manage your projects and visualize the outputs of modules. It consists of a navigation bar at the top of the screen, where you can click on different buttons to open several windows with various functionalities. The available options are:
-
Edit Mode: In this mode, you can modify the configuration of a city by editing the land uses of the grid that represents the city.
-
Scenarios: In the scenarios menu, you can save the current configuration of the city by assigning it a name and a description. Later in the process, you can switch between different scenarios of your city to study the impact of various interventions on the land, or simply to save different possibilities and analyze the metrics afterward.
-
Layers: In the layers menu, you can select which layers of the visualization you want to see and adjust the opacity of each one. This feature is particularly useful when working with complex visualizations, as it enables you to focus on specific elements.
-
View: This menu allows us to toggle different visibility settings for the map.
-
Radar Chart: In the radar chart window, you can display various metrics and KPIs related to your project. Initially, this will be empty; you must connect a module to the project in order to see data displayed.
-
Land Use: In this menu, you can see the current distribution of land uses within the project.
-
Bar Chart: In the bar chart window, you can display various metrics and KPIs related to your project using a bar plot. Initially, this will be empty; you must connect a module to the project in order to see data displayed.
-
Modules: In the modules window, you can view and select always-available modules that are independent of the projects. When selecting a module, it will compute the results for your project and display them in the interface.
